| Weather Data | |||
|---|---|---|---|
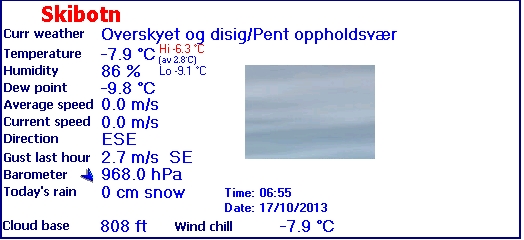
| LAST READING AT TIME: 06:55 DATE: 17 October 2013, time of next update: 06:56 | |||
| Current Weather | Overskyet og disig/Pent oppholdsvær | Current Temperature | -7.9°C (17.8°F), Apparent temp -10.3°C, Apparent temp solar -10.3°C |
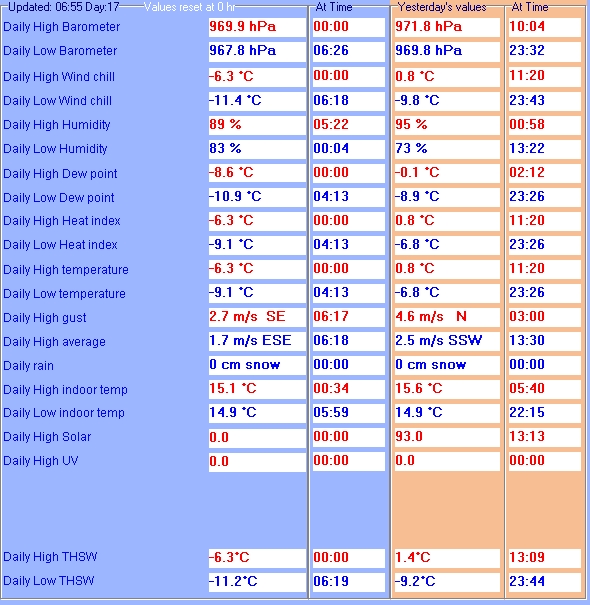
| Maximum Temperature (since midnight) | -6.3°C at: 00:00 | Minimum Temperature (since midnight) | -9.1°C at: 04:13 |
| Average windspeed (ten minute) | 0.0 m/s | Wind Direction (ten minute) | ESE (112°) |
| Windchill Temperature | -7.9°C | Maximum Gust (last hour) | 2.7 m/s at: 06:17 |
| Maximum Gust (since midnight) | 2.7 m/s at: 06:17 | Maximum 1 minute average (since midnight) | 1.7 m/s at: 06:18 |
| Rainfall (last hour) | 0.0 mm | Rainfall (since midnight) | 0.0 mm (0.00 in.)--- |
| Rainfall This month | 10.0 mm (0.39 in.) | Rainfall To date this year | 342.2 mm (13.47 in.) |
| Maximum rain per minute (last hour) | 0.0 mm/min | Maximum rain per hour (last 6 hours) | 0.0 mm/hour |
| Yesterdays rainfall | 0.0 mm | DewPoint | -9.8°C (Wet Bulb :-8.4°C ) |
| Humidity | 86 %, Humidex -11.8°C | Barometer corrected to msl | 968.0 hPa |
| Pressure change | -0.2 hPa (last hour) | Trend (last hour) | STEADY |
| Pressure change (last 12 hours) | -2.6 hPa | Pressure change (last 6 hours) | -1.6 hPa |
| Current Indoor Temp. 14.9°C | |||
| Current Indoor Hum. 31% | |||
| Current solar | 0 W/M² | Current UV | 0.0 |
| Maximum solar (since midnight) | 0 W/M² | Maximum UV (since midnight) | 0.0 |
| Current 00:00 hours of sunshine today, current sky: Overskyet og disig | |||
| Sunshine hours for the year: | 591:14 hrs | Sunshine hours for the month: | 08:06 hrs |
| Current evapotranspiration rate 0.1 mm per day. Yesterday's reading 0.1 | |||


Use the RELOAD facility on your browser to retrieve the latest data.